2 Charts That Show the Truth about Home Affordability
Brent Wells December 5, 2017
Brent Wells December 5, 2017
There is a lot of discussion about the current state of housing affordability for both first-time and move-up buyers, and much of the narrative is tarnished with a negative slant. However, the truth is that housing affordability is better today than at almost any time in our history.
The naysayers are correct in the fact that affordability today is not as good as it has been over the last several years. But, we must remember that home prices collapsed during the housing crash, and distressed properties (foreclosures and short sales) kept home values depressed for years. When we compare affordability to the decades that proceeded the crash, a different story is revealed.
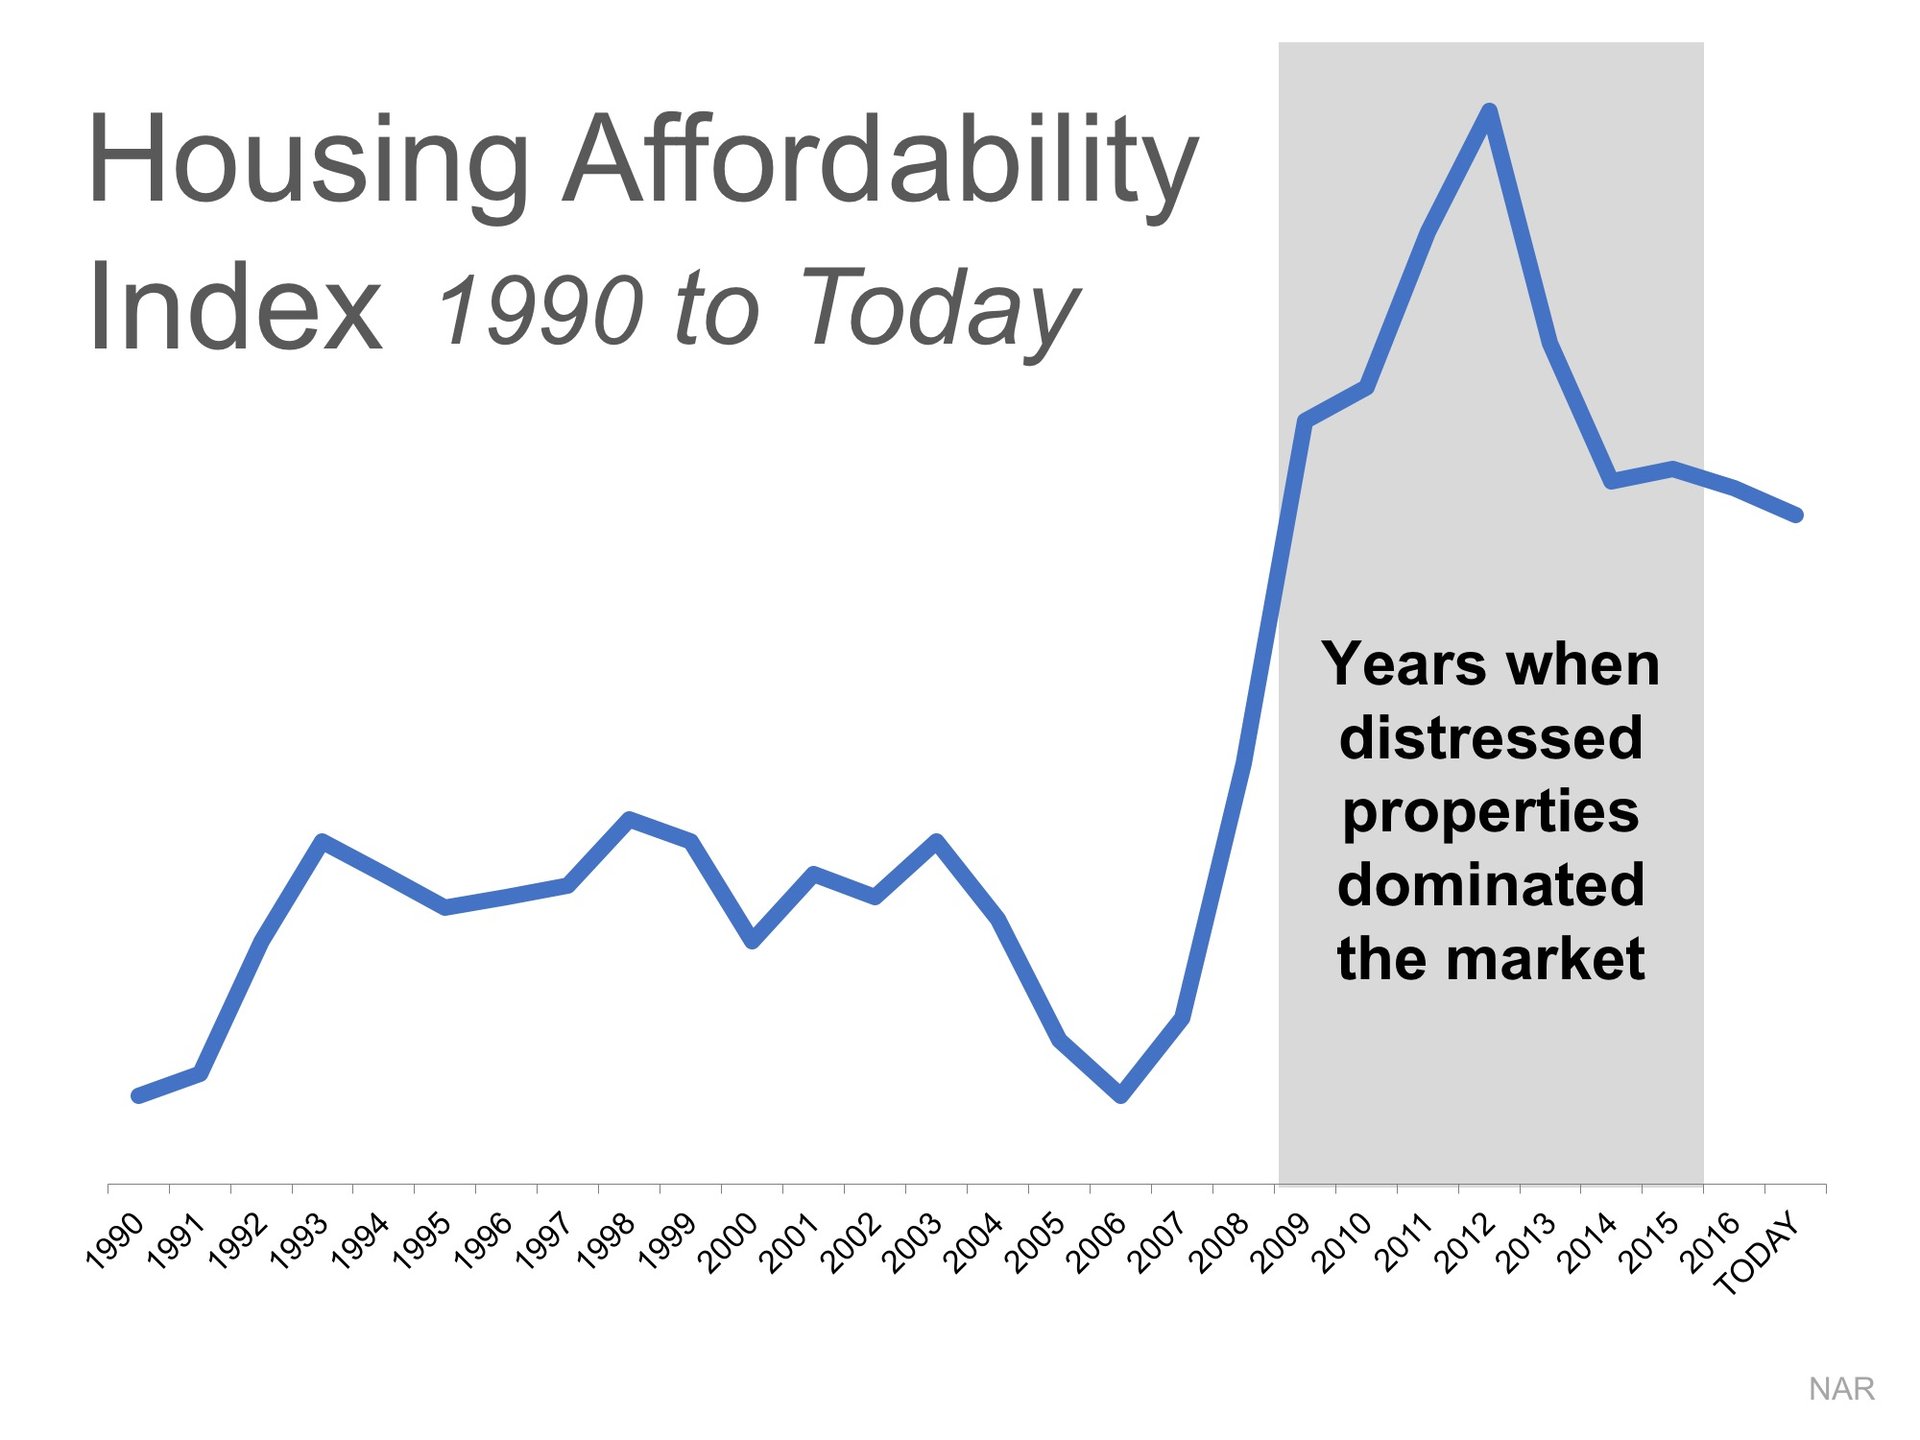
Here is a graph of the National Association of Realtors’ Housing Affordability Index. The higher the graph, the more affordable homes are.
We can see that affordability is better today than in the fifteen years prior to the boom and bust.
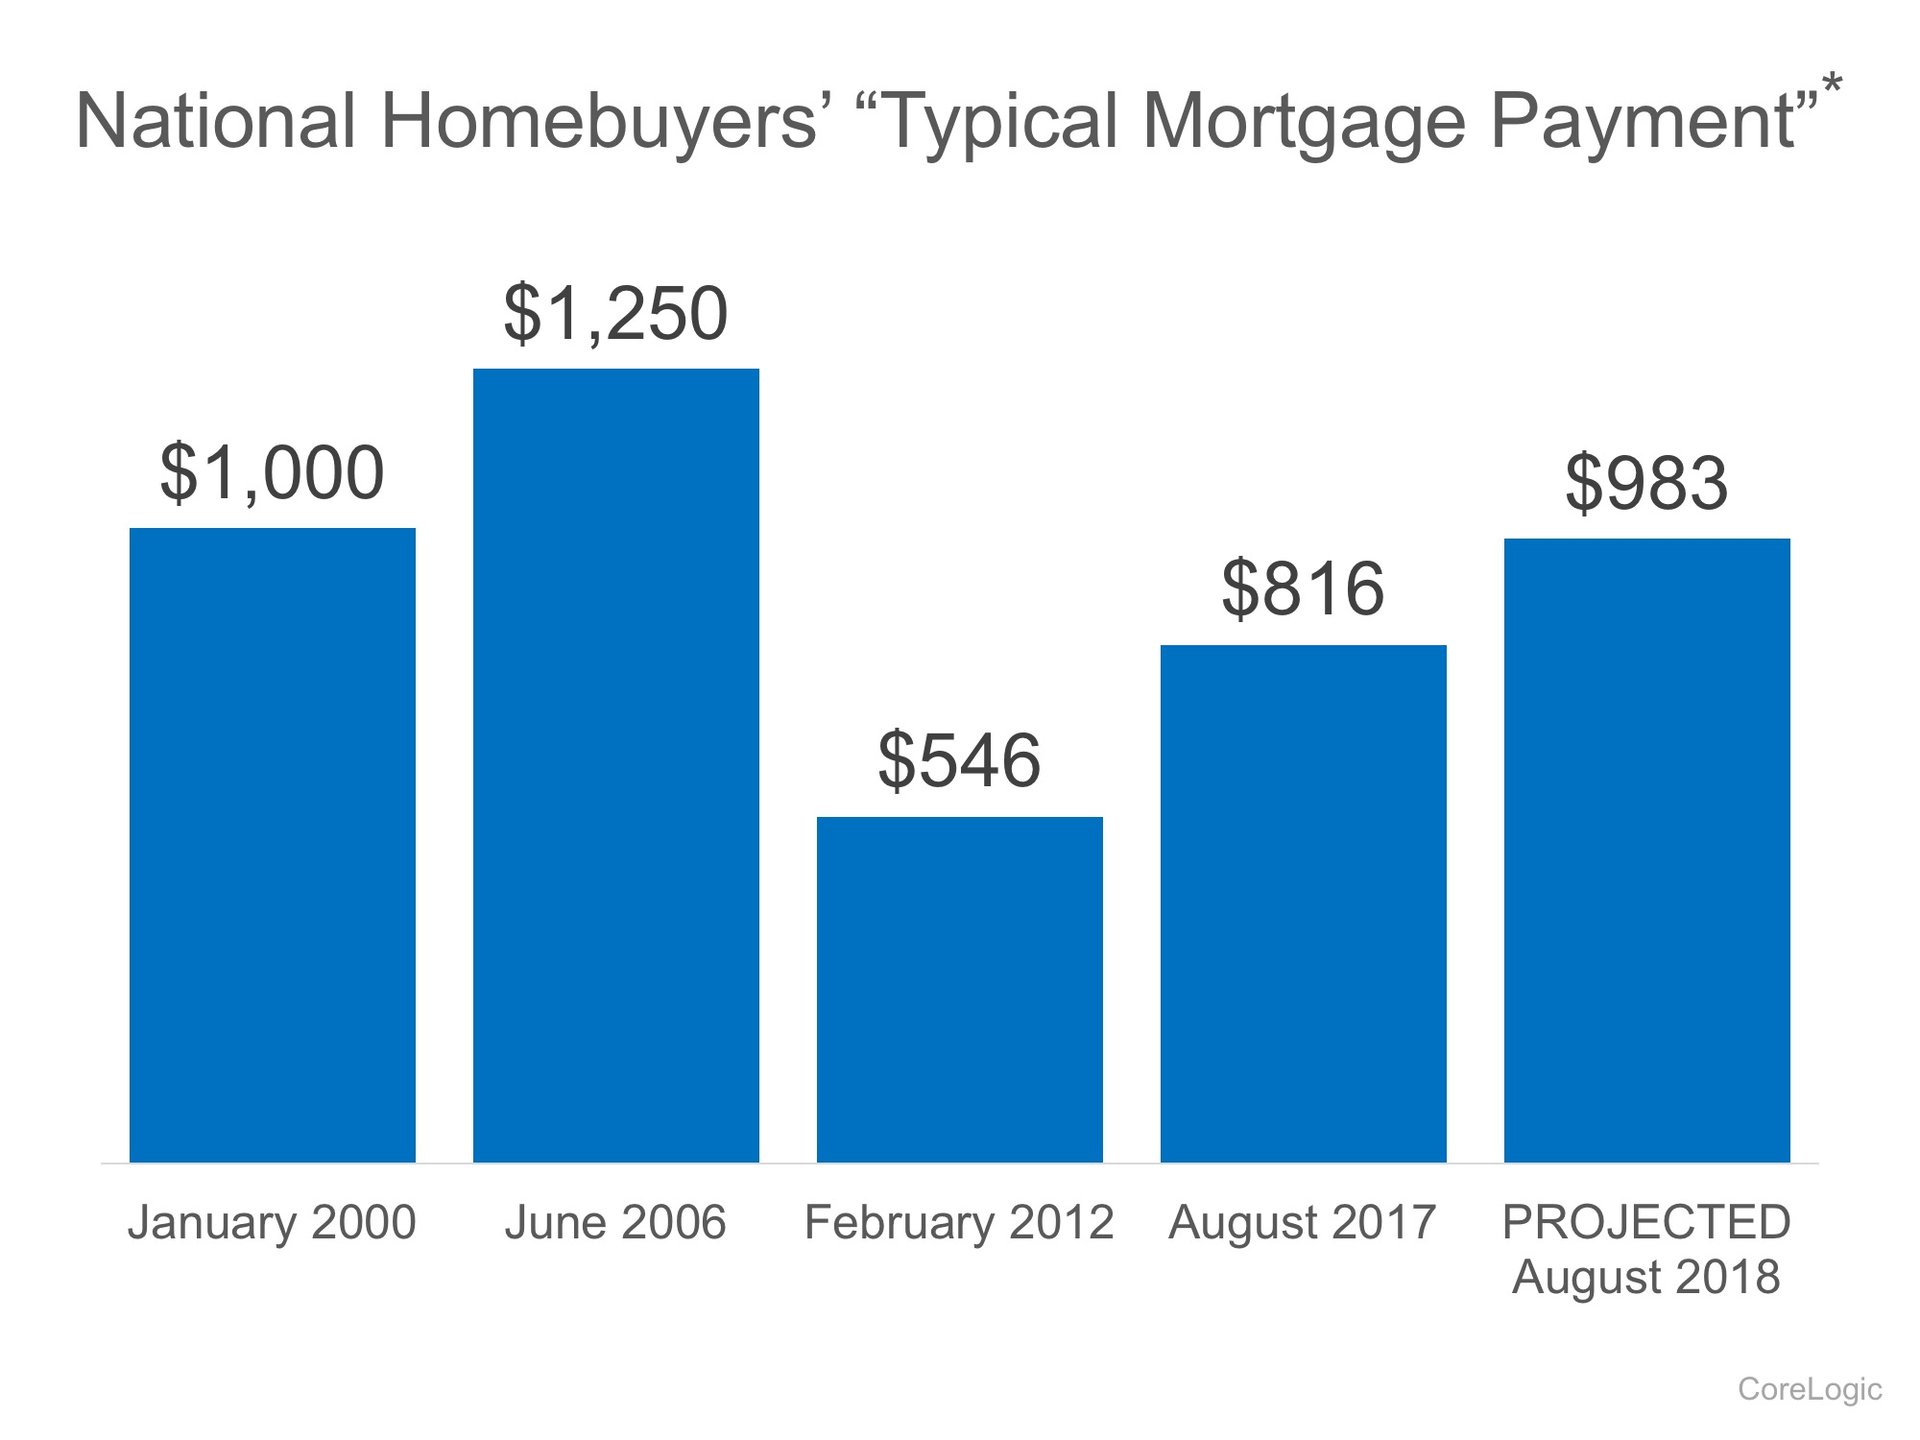
CoreLogic just published a report showing the National Homebuyers’ “Typical Mortgage Payment.” Here is a graph of their findings:
It reveals that, though a ‘typical’ housing payment was less expensive in 2012 (remember distressed properties), it is currently less expensive than it was in 2000 and is still projected to be lower next year than it was in 2000.
Mark Fleming, Chief Economist at First American, explained it best:
“While borrowing power for the potential home buyer has fallen relative to the low point of 2012, it remains high today and will remain high next year, relative to the long run average. If you don’t want to rent anymore and are considering becoming a homeowner, even if mortgage rates rise next year, your borrowing power will remain strong by historic standards.”
Stay up to date on the latest real estate trends.

If you're not already familiar with the Celina story, the numbers speak for themselves.
EV-Ready Living. Light Farms offers electric car charging stations within the community.
Buying a new construction home is a fundamentally different process than buying a resale property.

You’re clearing multiple rooms, a garage, attic, shed, or light remodel debris.

You find yourself only using part of the house while the rest collects dust.

Keeping the same flooring throughout the main living areas helps create a smooth, cohesive flow.
Overpricing, even by a little, can cause a listing to sit stale — which often leads to price drops.
Every week I am visiting with many new homes sales associates and I am hearing a consistent story.
North Sky is a June 2025 favorite, with new contemporary homes featuring open layouts and smart tech.
We'd love to hear from you! Whether you're buying, selling, or just exploring your options, we're here to provide answers, insights, and the support you need. Contact us and start planning your next move.