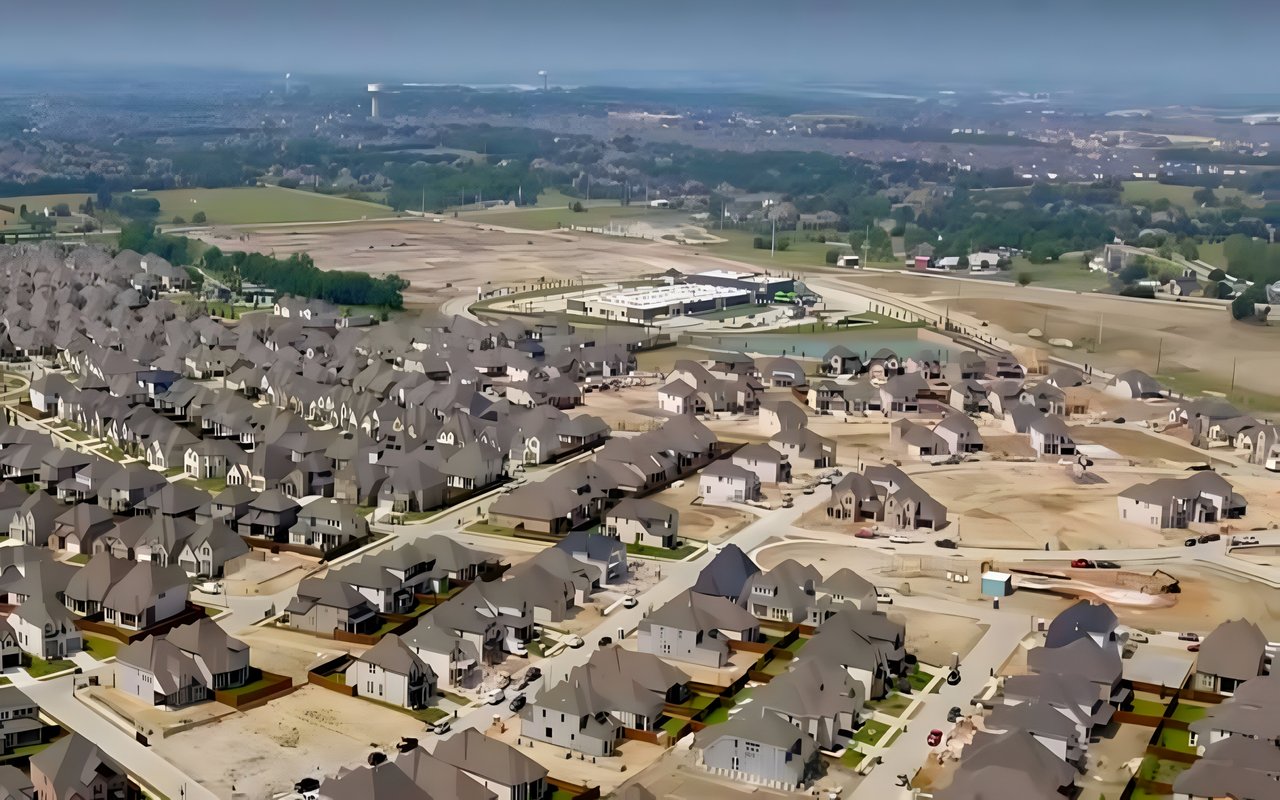
Physically located in Celina, TX, but many home buyers mistakenly think it is a Prosper neighborhood.
Lilyana is physically located in Celina, TX, but many home buyers mistakenly think it is a Prosper neighborhood. One of the top Google search terms is 'Lilyana Prosper, ' which shows how many people misunderstand where the neighborhood is located. We assure you that the homes are in Celina, but Lilyana's children attend Prosper ISD schools. Lilyana residents now have their neighborhood elementary school named Lilyana Elementary School.
1,631 people live in Lilyana, where the median age is 38 and the average individual income is $66,062. Data provided by the U.S. Census Bureau.
Total Population
Median Age
Population Density Population Density This is the number of people per square mile in a neighborhood.
Average individual Income
There's plenty to do around Lilyana, including shopping, dining, nightlife, parks, and more. Data provided by Walk Score and Yelp.
Explore popular things to do in the area, including Sushi nunu, C-Town Yoga, and Carrie Radish Wax Co.
| Name | Category | Distance | Reviews |
Ratings by
Yelp
|
|---|---|---|---|---|
| Dining · $$ | 3.64 miles | 200 reviews | 4.6/5 stars | |
| Active | 3.95 miles | 4 reviews | 5/5 stars | |
| Beauty | 3.72 miles | 9 reviews | 5/5 stars | |
| Beauty | 4.89 miles | 52 reviews | 4.9/5 stars | |
| Beauty | 3.84 miles | 4 reviews | 5/5 stars | |
| Beauty | 3.46 miles | 4 reviews | 5/5 stars | |
|
|
||||
|
|
||||
|
|
||||
|
|
||||
|
|
||||
|
|
Lilyana has 558 households, with an average household size of 3. Data provided by the U.S. Census Bureau. Here’s what the people living in Lilyana do for work — and how long it takes them to get there. Data provided by the U.S. Census Bureau. 1,631 people call Lilyana home. The population density is 5,468 and the largest age group is Data provided by the U.S. Census Bureau.
Total Population
Population Density Population Density This is the number of people per square mile in a neighborhood.
Median Age
Men vs Women
Population by Age Group
0-9 Years
10-17 Years
18-24 Years
25-64 Years
65-74 Years
75+ Years
Education Level
Total Households
Average Household Size
Average individual Income
Households with Children
With Children:
Without Children:
Marital Status
Blue vs White Collar Workers
Blue Collar:
White Collar:
We'd love to hear from you! Whether you're buying, selling, or just exploring your options, we're here to provide answers, insights, and the support you need. Contact us and start planning your next move.