Being developed by CastleRock Communities and offers almost 400 homes sitting on 40’, 50’, and 60’ lots.
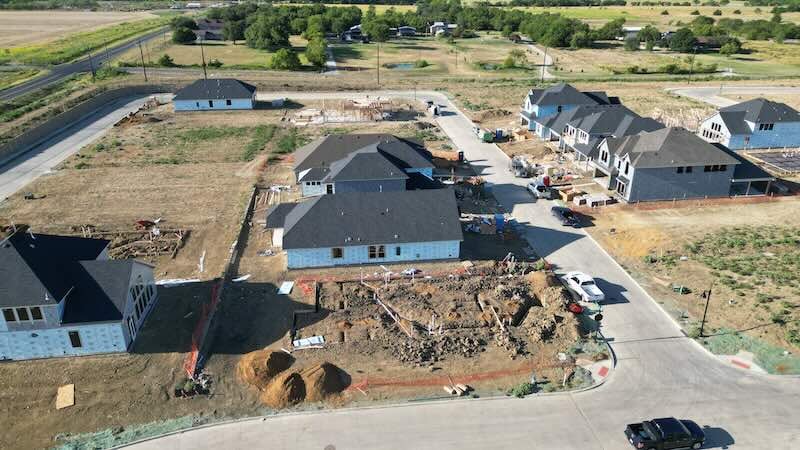
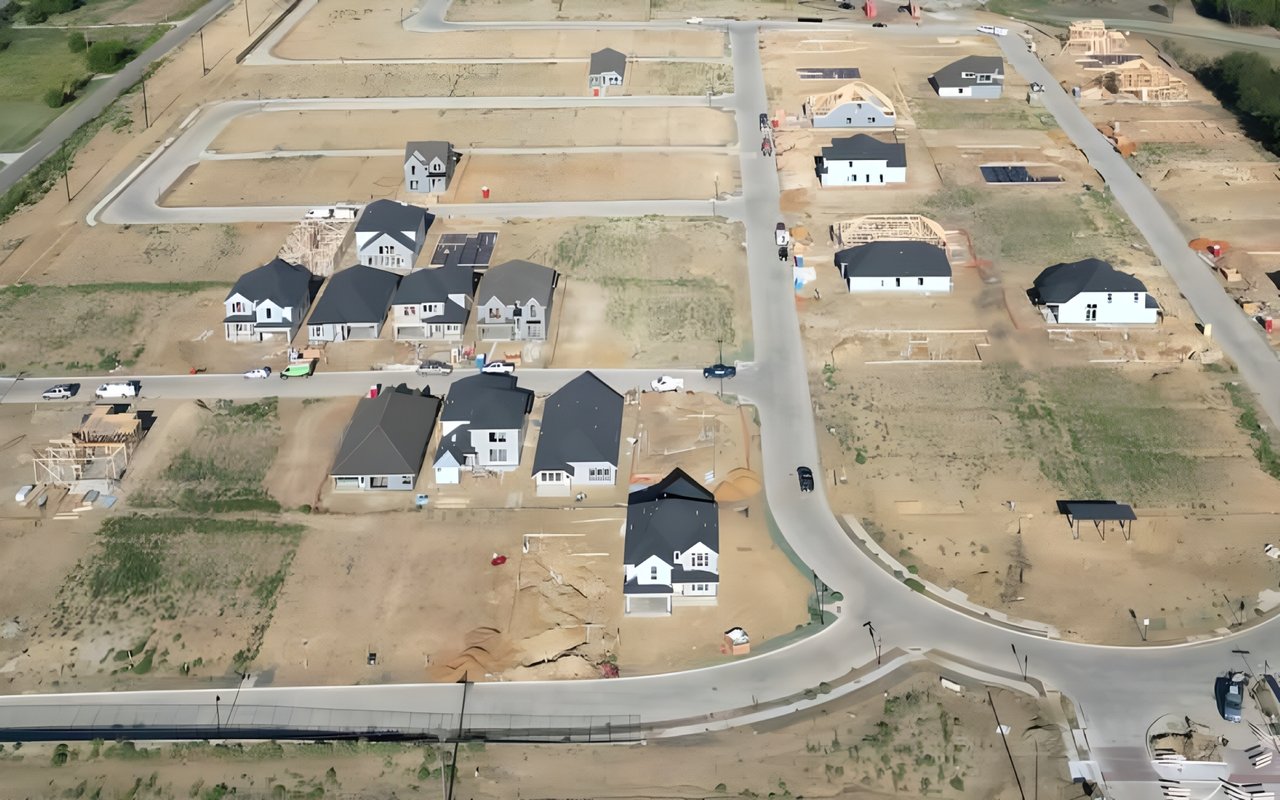
La Terra at Uptown Celina is being developed by CastleRock Communities and offers almost 400 homes sitting on 40’, 50’, and 60’ lots. This cute neighborhood features over 20 acres of green space, trails, and an amenity center with a pool. Homes start in the low 400's with options for 3-4 bedroom homes. Part of Celina ISD, it's designed for those wanting community life with urban convenience and is located just a couple of miles north-west of the historic downtown Celina Square.
30,257 people live in La Terra at Uptown Celina, where the median age is 37.6 and the average individual income is $58,555. Data provided by the U.S. Census Bureau.
Total Population
Median Age
Population Density Population Density This is the number of people per square mile in a neighborhood.
Average individual Income
There's plenty to do around La Terra at Uptown Celina, including shopping, dining, nightlife, parks, and more. Data provided by Walk Score and Yelp.
Explore popular things to do in the area, including Sis’s Country Store, Valley Vines, and Stella’s Ice Cream.
| Name | Category | Distance | Reviews |
Ratings by
Yelp
|
|---|---|---|---|---|
| Dining | 4.81 miles | 10 reviews | 5/5 stars | |
| Dining | 2.23 miles | 24 reviews | 5/5 stars | |
| Dining | 2.12 miles | 7 reviews | 5/5 stars | |
| Dining | 4.81 miles | 9 reviews | 5/5 stars | |
| Beauty | 1.61 miles | 11 reviews | 5/5 stars | |
|
|
||||
|
|
||||
|
|
||||
|
|
||||
|
|
||||
|
|
La Terra at Uptown Celina has 9,377 households, with an average household size of 3.22. Data provided by the U.S. Census Bureau. Here’s what the people living in La Terra at Uptown Celina do for work — and how long it takes them to get there. Data provided by the U.S. Census Bureau. 30,257 people call La Terra at Uptown Celina home. The population density is 307 and the largest age group is Data provided by the U.S. Census Bureau.
Total Population
Population Density Population Density This is the number of people per square mile in a neighborhood.
Median Age
Men vs Women
Population by Age Group
0-9 Years
10-17 Years
18-24 Years
25-64 Years
65-74 Years
75+ Years
Education Level
Total Households
Average Household Size
Average individual Income
Households with Children
With Children:
Without Children:
Marital Status
Blue vs White Collar Workers
Blue Collar:
White Collar:
We'd love to hear from you! Whether you're buying, selling, or just exploring your options, we're here to provide answers, insights, and the support you need. Contact us and start planning your next move.