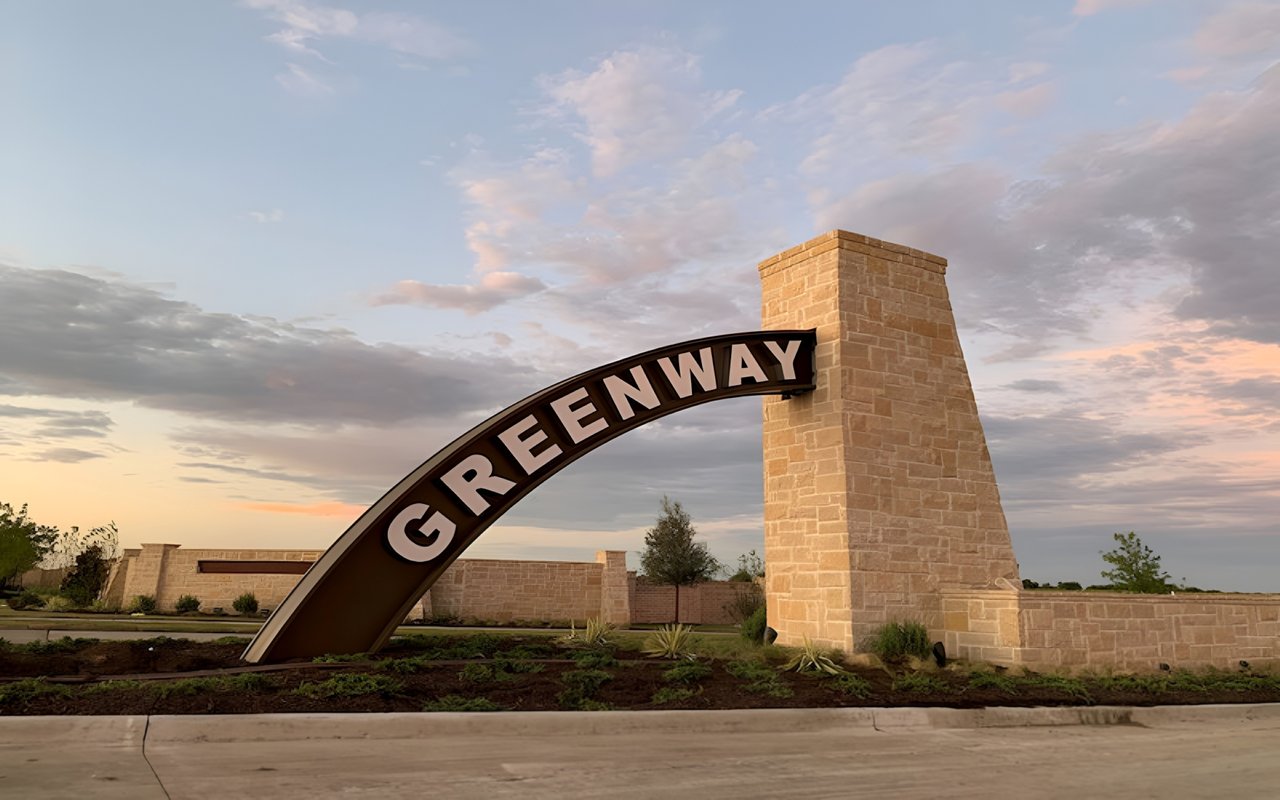
Greenway Homes for Sale
The charming Celina neighborhood attracts homebuyers for many reasons. An often-overlooked reason is a lack of MUD or PID, which can result in significant tax savings for Greenway residents.
The charming Celina neighborhood attracts homebuyers for many reasons. An often-overlooked reason is a lack of MUD or PID, which can result in significant tax savings for Greenway residents.
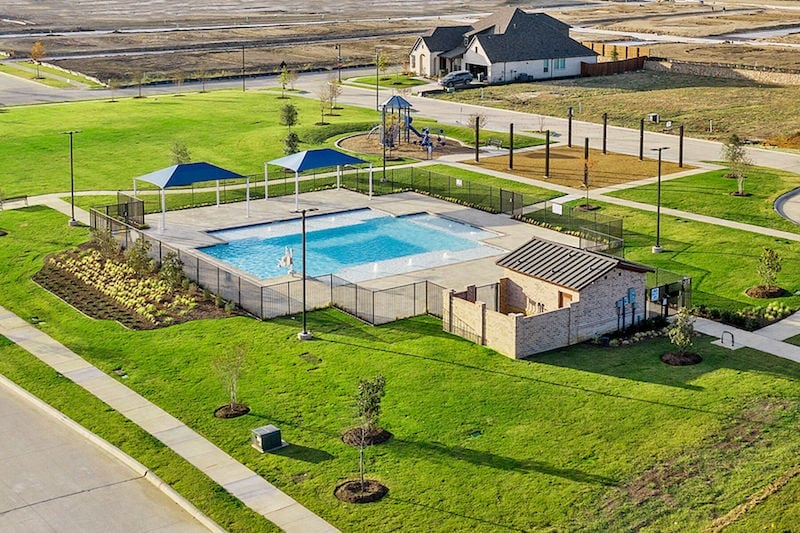
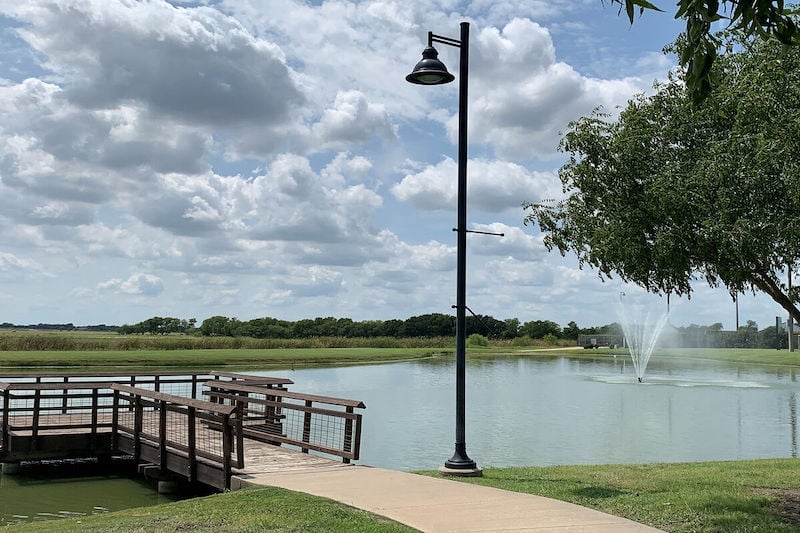
Come for the great value, but stay for the fantastic swimming pool, picnic area, kids' playground, and paved hiking trails. Be sure to spend some time in the Hammock Garden; it's one of the only ones in the town of Celina.
30,257 people live in Greenway Homes for Sale, where the median age is 37.6 and the average individual income is $58,555. Data provided by the U.S. Census Bureau.
Total Population
Median Age
Population Density Population Density This is the number of people per square mile in a neighborhood.
Average individual Income
There's plenty to do around Greenway Homes for Sale, including shopping, dining, nightlife, parks, and more. Data provided by Walk Score and Yelp.
Explore popular things to do in the area, including Sis’s Country Store, Valley Vines, and Stella’s Ice Cream.
| Name | Category | Distance | Reviews |
Ratings by
Yelp
|
|---|---|---|---|---|
| Dining | 4.81 miles | 10 reviews | 5/5 stars | |
| Dining | 2.23 miles | 24 reviews | 5/5 stars | |
| Dining | 2.12 miles | 7 reviews | 5/5 stars | |
| Dining | 4.81 miles | 9 reviews | 5/5 stars | |
| Beauty | 1.61 miles | 11 reviews | 5/5 stars | |
|
|
||||
|
|
||||
|
|
||||
|
|
||||
|
|
||||
|
|
Greenway Homes for Sale has 9,377 households, with an average household size of 3.22. Data provided by the U.S. Census Bureau. Here’s what the people living in Greenway Homes for Sale do for work — and how long it takes them to get there. Data provided by the U.S. Census Bureau. 30,257 people call Greenway Homes for Sale home. The population density is 307 and the largest age group is Data provided by the U.S. Census Bureau.
Total Population
Population Density Population Density This is the number of people per square mile in a neighborhood.
Median Age
Men vs Women
Population by Age Group
0-9 Years
10-17 Years
18-24 Years
25-64 Years
65-74 Years
75+ Years
Education Level
Total Households
Average Household Size
Average individual Income
Households with Children
With Children:
Without Children:
Marital Status
Blue vs White Collar Workers
Blue Collar:
White Collar:
We'd love to hear from you! Whether you're buying, selling, or just exploring your options, we're here to provide answers, insights, and the support you need. Contact us and start planning your next move.


